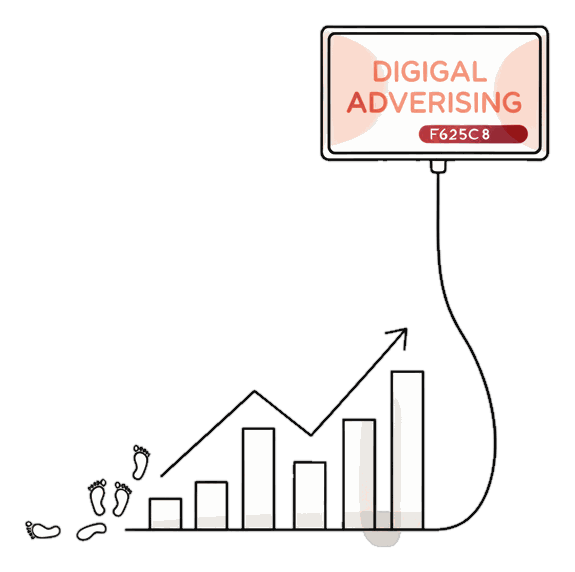
How to measure a DOOH campaign
For most of the history of out-of-home, measurement was the part you took on faith. A campaign ran, an estimated audience number came back, and you hoped the two were connected. Digital out-of-home changed that. A DOOH campaign is now measurable the same way a paid channel is: you set a control group, you log every play with a time and a place, and you read the outcome as the lift over people who never saw your screens. The result is a cost per action you can audit, not a modelled reach you have to trust.
The mechanics are simple to describe. Delivery is captured as verified plays, so you know the ad ran on a specific screen at a specific second. Outcomes are read as lift over a matched control: the increase in store visits, in site sessions and in purchases among exposed audiences compared with a similar group who were not exposed. Divide the media spend by those incremental actions and you have a cost per outcome. In Blindspot D2C campaigns those costs have come out at about $0.82 per incremental store visit, $0.80 per incremental web visit and $5.75 per incremental online purchase, each measured against a control. The D2C attribution guide walks through the lift study in detail.
This matters for a budget of any size, not only a small one. Measurement is what turns a media buy into a channel you can scale with confidence, because you are reading real exposure and real outcomes rather than paying for filler plays and estimated eyeballs. The same discipline that proves a first campaign worked is what lets a growth team decide to put a much larger budget behind out-of-home, and read whether the bigger flight lands as hard as the small one did. If you are new to the format, the what is DOOH guide covers the basics.
The measurement play, 4 steps
The whole method fits in four moves. Set them up before the flight starts and the campaign measures itself as it runs. Blinky, the free AI planner, will draft the media plan for you from a one-line brief, and the platform captures the delivery data you need to run the read.
Before the flight starts, define the exposed audience, the people who will see your screens, and a matched control group who will not. Matching on geography, demographics and behaviour is what makes the later lift a real read rather than a guess, because the control tells you what would have happened without the campaign. This is the step feed platforms usually skip, and the one that makes an out-of-home number honest.
Deliver the campaign and capture a geo-tagged, time-stamped proof-of-play for every appearance. This is the receipt that an ad ran on a specific screen at a specific second, so the delivery you paid for is auditable and every later outcome is anchored to real plays. Because Blindspot bills per play, you pay for the appearances that happened, not a modelled average.
Compare the exposed audience with the control group on store visits and on site sessions. The increase over control is the incremental foot-traffic lift and web lift. Blindspot campaigns have measured an incremental store visit at about $0.82 and an incremental web visit at about $0.80, using a device panel seen near your screens matched against a control who were not.
Compare purchases from the exposed group with the control group to read the incremental sales the exposure drove. Divide media spend by that lift for a cost per incremental purchase, measured at about $5.75 against typical paid-social acquisition costs of $15 to $40. That control-based cost per outcome is the number to put next to your blended acquisition cost.
That is the entire play. You are not waiting on a post-campaign report from a planner; the control is set, the plays are logged, and the lift is read against it. If you want a starting draft, describe the audience and the goal to Blinky and refine the plan it gives you.
What each metric means, and its cost
Four measurements decide whether a DOOH campaign worked, and each has a Blindspot source that produces it and a benchmark to read it against. Impressions are useful for planning reach, and older out-of-home was often sold on an estimated CPM, a forecast cost per thousand views. The numbers below are different: they are logged facts and outcomes over control, so they hold up when a growth team audits them.
| Metric | What it means | Blindspot source | Benchmark |
|---|---|---|---|
| Incremental store visit | The added store trips among exposed people versus control | Foot-traffic lift study, device panel vs matched control | ~$0.82 per visit |
| Incremental web visit | The added site sessions among exposed audiences versus control | Web lift study, exposed vs control | ~$0.80 per visit |
| Incremental online purchase | The added purchases the exposure drove versus control | Sales lift study, exposed vs control | ~$5.75, vs $15 to $40 paid-social CPA |
| Verified plays | The appearances that actually ran, logged with time and place | Geo-tagged, time-stamped proof-of-play | Auditable, every play accounted for |
Read every cost as spend divided by the incremental actions over control, not the total actions. Your own numbers depend on your category, price point and creative; the figures here are what Blindspot D2C campaigns have measured, and the honest way to compare them is against a blended acquisition cost. See the attribution guide for the full lift-study method and DOOH statistics for the wider industry picture.
$0.82
per incremental store visit, measured over control
$0.80
per incremental web visit, exposed vs control
$5.75
per incremental online purchase, vs $15 to $40 on paid social
104%
web-traffic lift measured for UiPath
What the numbers mean for your CAC
Take a D2C brand comparing channels. On paid social, a typical acquisition cost runs $15 to $40, and the number usually rests on a last click the platform claims but may not have caused. On out-of-home, the exposed group is compared with a matched control, and only the incremental purchases above that control are counted. In the campaigns measured here, that produced an incremental online purchase at about $5.75, a store visit at about $0.82 and a web visit at about $0.80, each a proven action rather than a self-reported credit.
The reason this is an efficiency story and not a discount story is that measurement lets you cut what is not working and pour budget into what is. Because Blindspot is priced per play and scheduled per screen by the hour, once a lift study shows which screens and which hours drove the lift, you concentrate the budget there and drop the rest. Hourly buying alone typically removes 30% or more of the waste a traditional all-day flight carries, and measurement is what tells you exactly where the productive plays are. The hourly scheduling guide covers that control.
This is the same logic at a small budget and a large one. A first campaign uses the read to prove the channel and earn a bigger budget; a global flight uses it to keep a large spend honest, screen by screen. A worldwide tourism campaign on Blindspot logged 2,146,892 verified plays and delivered 87% more plays than planned by concentrating delivery where it counted, the Maharashtra Tourism case shows the scale. UiPath, running out-of-home as a performance channel, measured a 104% web-traffic lift, the UiPath case has the full numbers.
Where DOOH fits in a performance stack
Once a campaign is measured this way, out-of-home stops being a brand line item you cannot account for and becomes a channel in the performance stack, sitting next to search and social with a cost per action you can compare. The difference is the attribution logic. A feed platform tends to claim a last click it often did not cause; a DOOH lift study counts only the actions above a control group, which is the number a growth marketer should be comparing against a blended acquisition cost in the first place.
Proof-of-play removes the guess about whether an ad ran, and the control-group lift removes the guess about whether it drove an outcome. Together they give out-of-home the same audit trail a marketer expects from the feeds, with an honesty the feeds rarely offer. That is what lets you put an out-of-home number in the same spreadsheet as the rest of the stack and defend it. When the read is good, you scale it; when a screen or an hour underperforms, you drop it, the same loop you already run on your other channels.
Measure the lift over control, not the last click.
The measurement play, in one line
To set it up, describe your audience and goal to Blinky for a draft plan, or open the map to pick screens yourself and read the per-play price before you book. When the flight ends, run the lift against your control and read the cost per outcome. See how booking works to publish a measurable campaign, live in about 48 hours.