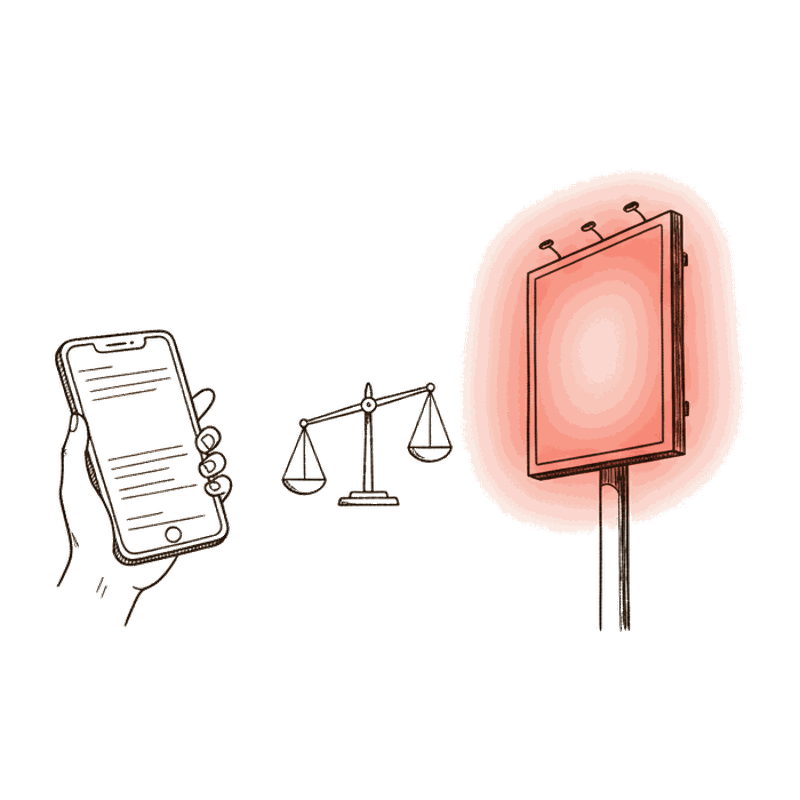
Both are commonly quoted in CPM, but they are very different media
CPM survived from print and broadcast into both digital out-of-home and paid social because it lets a buyer compare very different media on one line: the cost of 1,000 modelled impressions. That convenience is also the trap, because the two media it is comparing could not be more different in how an audience actually experiences the ad.
A DOOH play happens on a public screen: a billboard, a transit panel, a mall display. Nobody in range of that screen can scroll past it, close it, install a blocker for it or skip it after five seconds. It is either in a passer-by's field of view or it is not; there is no interaction to opt out of.
A social impression happens inside a private, scrollable feed, on a device the user controls completely. The same behavior that makes social measurable, every scroll, tap and skip logged by the platform, also makes its ads easy to avoid: users scroll past most feed content in well under a couple of seconds, ad blockers exist for browsers even if not for native apps, and platforms themselves report rising ad fatigue as feeds fill with more sponsored content.
Neither fact makes one medium better than the other. It does mean that a CPM on a DOOH screen and a CPM on a social feed are not describing the same kind of exposure, even when the two numbers happen to land close together. The rest of this guide keeps that difference in view while it lines up the published figures.
The CPM benchmarks, named source by named source
The dimensions that actually decide the comparison. DOOH figures are attributed to StackAdapt, Growth Channel and AdQuick; social figures are attributed to WebFX's 2026 Meta marketing benchmarks and AdAmigo's 2026 Meta Ads CPM benchmarks. Where a comparison is not like-for-like, the row says so.
| Dimension | DOOH | Social media |
|---|---|---|
| Named-source CPM range | StackAdapt $2 to $15; Growth Channel $2 to $7 (a separate $11.07 average per its October 15, 2025 article); AdQuick about $5 rising past $75 on Times Square spectaculars | Meta average $11.82 to $14.19 year over year into 2026, per WebFX; median about $13.48 |
| Ad avoidance and blocking | None available. A public screen cannot be scrolled past, closed or blocked | High. Feeds are built for scrolling past content, browser ad blockers exist, and platforms report rising ad fatigue |
| Measurement basis | A play is a logged appearance on a screen (Blindspot); a CPM elsewhere is a modelled audience estimate | An impression is logged automatically by the platform's own ad server the moment the ad loads |
| Minimum spend | None on Blindspot; priced per play from $0.23, no flight minimum | No official platform minimum; ad sets require an ongoing daily budget to stay in delivery |
$2
bottom of StackAdapt's DOOH CPM range
$15
top of StackAdapt's DOOH CPM range
$14.19
Meta average CPM, 2026 (WebFX)
$25.22
Meta November-peak median CPM (AdAmigo)
Facebook CPM alone averages about $7.47, and Instagram runs roughly $6.25 to $7.68, per the same WebFX benchmarks. Industry sets the range further: Meta CPMs run from about $6.96 in hardware and automotive up to about $12.46 in beauty and health, still per WebFX. Season moves it more than industry does: per AdAmigo's 2026 Meta Ads CPM benchmarks, the global median Meta CPM has ranged from about $15.74 in a January low to about $25.22 in a November peak over a recent 13-month stretch, and CPMs during Black Friday week can run 2 to 3 times normal levels. Geography moves it more still: AdAmigo puts Meta CPM at roughly $16 in the US, $12 in the UK and about $1.36 in India.
These are paid-social benchmarks published by third-party marketing benchmark sites, not Meta's own rate card, and actual CPMs vary by targeting, industry, season and geography, exactly the same caveat that applies to every DOOH figure above. See the fuller DOOH-only breakdown on DOOH CPM benchmarks 2026.
What CPM does not capture
A CPM tells you what 1,000 modelled impressions cost. It does not tell you whether anyone actually looked.
On social, an impression is logged the moment an ad loads in a feed, whether or not a person's eyes ever reach it. A muted autoplay video that a user scrolls past in under a second still counts. Ad blockers strip many display and video ads out of browsers before they load at all, and ad fatigue is well documented: the more sponsored content a platform serves into a feed, the faster users learn to scroll past it without registering it consciously.
On DOOH, the opposite problem does not exist in the same form: a public screen cannot be scrolled past, closed, muted or blocked, so a play that ran is, by definition, an ad that was physically present in a real place for real passers-by. The distinction is not that DOOH is automatically more effective per impression, that would need its own study, it is that a CPM comparison alone cannot answer that question, because a DOOH CPM and a social CPM are counting fundamentally different kinds of exposure to begin with.
The honest reading: comparing two CPM numbers side by side tells you which was cheaper to buy, not which reached more attention. Anyone treating identical CPMs as identical outcomes is skipping that step.
Play versus impression, explained carefully
Two units get confused constantly in this comparison, and it is worth being precise. A play, in Blindspot's own vocabulary, is one appearance of one ad on one screen, logged and verified after it runs. An impression, the unit CPM is built on, whether on DOOH or social, is a modelled or logged estimate of one ad view.
The arithmetic that does work: divide any CPM by 1,000 and you get the cost of one impression, in whatever currency it was quoted. A $14.19 Meta CPM is about $0.01419 per impression; a $7 DOOH CPM is about $0.007 per impression. That division is exact and holds for both media, because CPM is defined as a cost per 1,000 impressions regardless of what generated them.
The arithmetic that does not work: treating that per-impression figure as directly comparable to Blindspot's own per-play price. A play and an impression are not the same unit. On DOOH specifically, one play can be seen by more than one passer-by, so a single play typically delivers more than one impression, and the ratio between them varies by screen, format, dwell time and time of day. Blindspot does not publish a fixed impressions-per-play figure, because no single ratio holds across a roadside panel, a mall corridor and a Times Square spectacular, and a guessed number would be worse than none.
The practical rule stands regardless of which medium is on the other side of the comparison: converting a CPM to a per-impression cost is simple division, but converting that per-impression cost to a per-play cost requires knowing a screen's audience per play, a figure this guide does not invent.
A play and an impression are not the same unit, and this guide does not pretend they are.
The one conversion this page will not invent
Why many brands run both, not one instead of the other
Given the split above, cheap-versus-expensive is the wrong lens for most media plans. DOOH and social solve different problems in the same funnel, and the research on DOOH already points at why: OAAA and Nielsen research cited on Blindspot's DOOH statistics 2026 page found 76% of consumers took an action after seeing a DOOH ad, and over half were prompted to act on a mobile device, meaning a public screen frequently sends people straight into the private feeds social already owns.
A common pattern: DOOH supplies the unavoidable, public first exposure, in the exact hours and streets an audience actually moves through, while social supplies the retargeting, the click path and the direct-response layer once someone is already searching or scrolling. Neither channel does the other's job well. A billboard cannot capture a click, and a feed ad cannot occupy a subway platform the way a screen can.
The budget question is not "DOOH or social," it is how much of a plan should sit in each layer, and that answer depends on the brief, not on which CPM number is smaller. A brand testing a new city might lean on Blindspot's planning and buying guides to book the public layer by the hour and by play, while running its existing social spend in parallel rather than pausing it. See the pricing and data hub for the wider set of guides behind every figure in this comparison.