The Death of the Impression: Foot Traffic is the New North Star for OOH
For decades, billboard advertisers accepted a frustrating tradeoff: spend big, hope for results, and trust that “estimated impressions” meant something. That era is over.
Foot traffic measurement in billboard advertising has fundamentally changed what outdoor media can prove and what brands should demand from it. Today’s marketers aren’t satisfied with reach estimates. They want to know whether someone saw the sign and then walked through the door.
According to signs.com, approximately 74% of consumers take a specific action like searching for a brand or visiting a physical store after exposure to a digital billboard.
That single statistic reframes everything. Billboards don’t just build awareness. They trigger behavior.
Then vs. Now: How OOH Metrics Have Evolved
The Shift: Trading Vanity for Veracity
Legacy OOH is built on “maybe.” Modern DOOH is built on “did.” To compete today, you have to swap outdated proxies for verified outcomes.
- Swap Estimated Impressions for Verified Foot Traffic Lift: Stop guessing how many eyeballs hit the vinyl. Start counting how many feet crossed the threshold.
- Kill Daily Traffic Counts (DEC); Use Mobile ID Attribution: DECs are a relic of the past. Mobile IDs provide the digital breadcrumbs of real-world movement.
- Move Beyond Demographic Reach to Exposed vs. Unexposed Comparisons: Don’t just target “moms.” Compare the people who actually saw your ad against a control group to prove the lift is real.
- Trade Share of Voice for Path-to-Purchase Conversion: Owning the conversation is an ego play. Measuring the conversion is a business play.
- Replace Gross Rating Points (GRPs) with In-Store Visit Incrementality: GRPs are for professors. Incrementality is for performance marketers who need to justify every dollar of spend.
This shift reflects a broader transformation: billboards are no longer just a brand awareness tool—they’re a performance marketing channel.
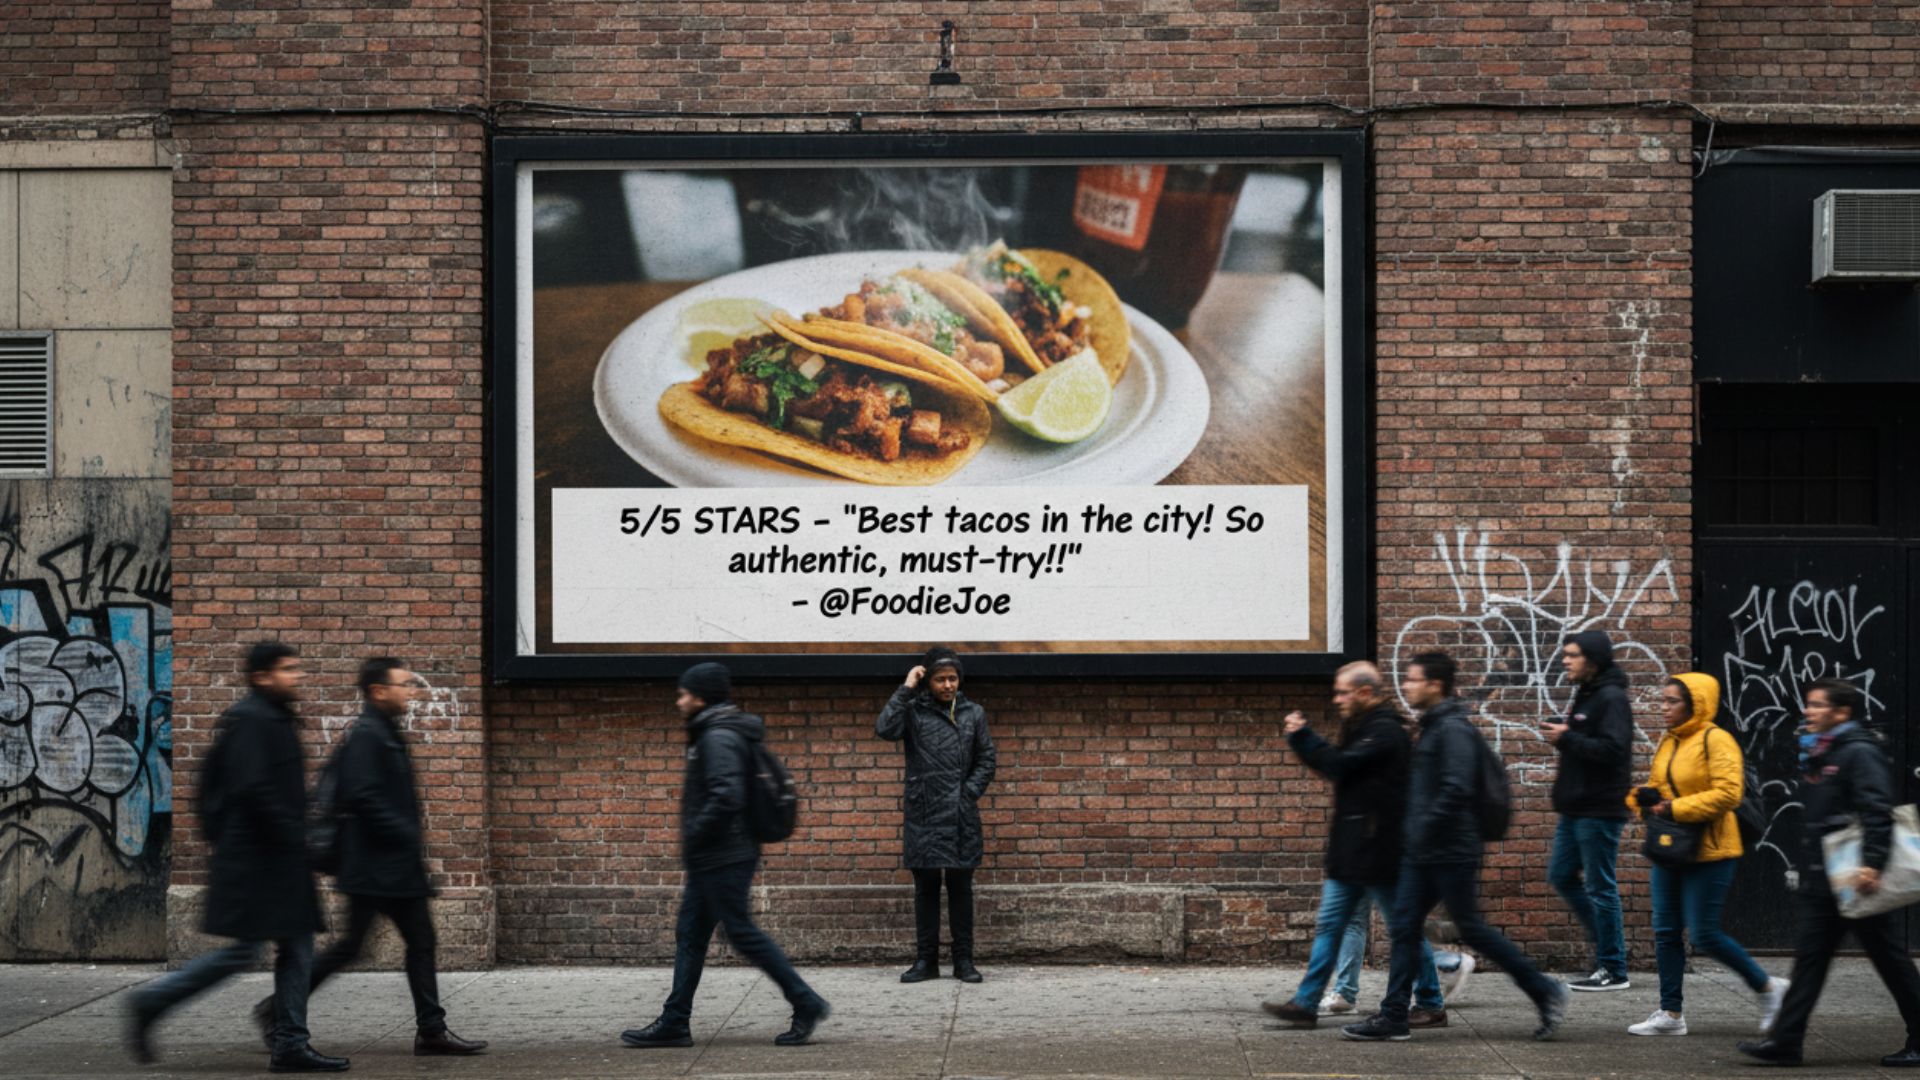
The “second screen” effect accelerates this. A driver sees a billboard, pulls out their phone at the next red light, and searches the brand. That mobile ping creates a data trail. That trail connects the physical sign to a real human action.
The question, then, isn’t whether billboards drive foot traffic. It’s how you measure it accurately. Five proven methods make that possible.
5 Proven Methods to Measure Billboard Foot Traffic Lift

Understanding that foot traffic matters is one thing. Knowing how to measure it accurately is where strategy gets real. The best foot traffic measurement billboard advertising tools range from high-tech mobile attribution platforms to surprisingly simple direct-response tactics — and the right choice depends on your budget, goals, and existing data infrastructure. Here’s a breakdown of five methods that actually work.
1. Mobile ID Attribution
Best For: Brands wanting granular, path-to-purchase insights at scale.
Mobile ID attribution tracks anonymized device pings as consumers move through the physical world — and it’s become one of the most powerful tools in OOH campaign measurement. According to industry experts, “with mobile IDs, advertisers can determine how often people pass by their billboards, which demographic groups engage the most, and what actions viewers take after seeing an advertisement.” In practice, a device that passes a billboard on a Tuesday and walks into your store on Thursday creates a trackable conversion event — without any personally identifiable information. That closed-loop visibility transforms billboard advertising from a brand awareness exercise into a verifiable performance channel, giving marketers the kind of exposure-to-visit data that was simply unavailable a decade ago.
2. Geofencing and Control Groups
Best For: Measuring true incrementality, not just correlation.
Geofencing draws a virtual boundary around your billboard location and your store. By comparing visit rates between exposed audiences (those who entered the billboard zone) and a statistically matched control group (those who didn’t), you can isolate lift that’s genuinely caused by your ad — not seasonal trends or coincidence. This distinction matters enormously: without a control group, you’re measuring correlation, not causation and correlation can lead to expensive misreads.
For brands running campaigns across multiple markets, geofencing also enables side-by-side comparisons, isolating which placements are genuinely moving the needle versus which ones are simply benefiting from high ambient traffic. That level of granularity turns a gut-feel media buy into a repeatable, optimizable performance channel.
3. QR Codes and Promo Codes
Best For: Small-to-mid-size businesses needing simple, cost-effective tracking.
Don’t overlook the obvious. A unique QR code or promo code printed on a billboard creates a direct, measurable link between exposure and action. The data isn’t as rich as mobile attribution, but the accuracy of conversion tracking is hard to beat — and for businesses that aren’t yet using dedicated software, it’s often the fastest way to start building a performance baseline. What typically happens is conversion rates spike noticeably in the weeks immediately following a new creative launch, giving you a clear signal that the placement is working before you invest in more sophisticated measurement infrastructure.
4. Sales Data Integration
Best For: Retailers with robust POS systems looking to connect ad spend to revenue.
Overlaying billboard campaign timelines against point-of-sale data can reveal meaningful foot traffic spikes. This method works best when campaigns run in isolated markets, making it easier to attribute sales changes to OOH exposure specifically.
5. Hardware Solutions: Passive Wi-Fi and Bluetooth Counters
Best For: Brick-and-mortar locations needing hyper-local, real-time foot traffic counts.
Physical sensors installed inside or outside your location passively detect device signals, counting visitors without requiring any app download or opt-in. The data is highly localized and continuous, ideal for benchmarking baseline traffic before a campaign launches.
Each method has tradeoffs in cost, precision, and setup complexity. But the real power emerges when you layer them which leads to a deeper question: once you have the data, how do you use it to choose where your billboard should actually live?
Using Foot Traffic Data to Select the Perfect Billboard Site
Now that you know how to measure foot traffic lift, the next logical question is: where should you place your billboard in the first place? The right location isn’t simply the busiest intersection in town — it’s where your audience actually moves through their daily lives.
Step 1: Move Beyond “High Traffic” to “Relevant Traffic”
Raw vehicle or pedestrian counts are a starting point, not a destination. Modern foot traffic software layers demographic data on top of movement patterns, revealing who is actually passing a location. A billboard near a pediatric clinic and one near a sports bar may both log 50,000 weekly impressions, but for a children’s apparel brand, only one of those actually matters.
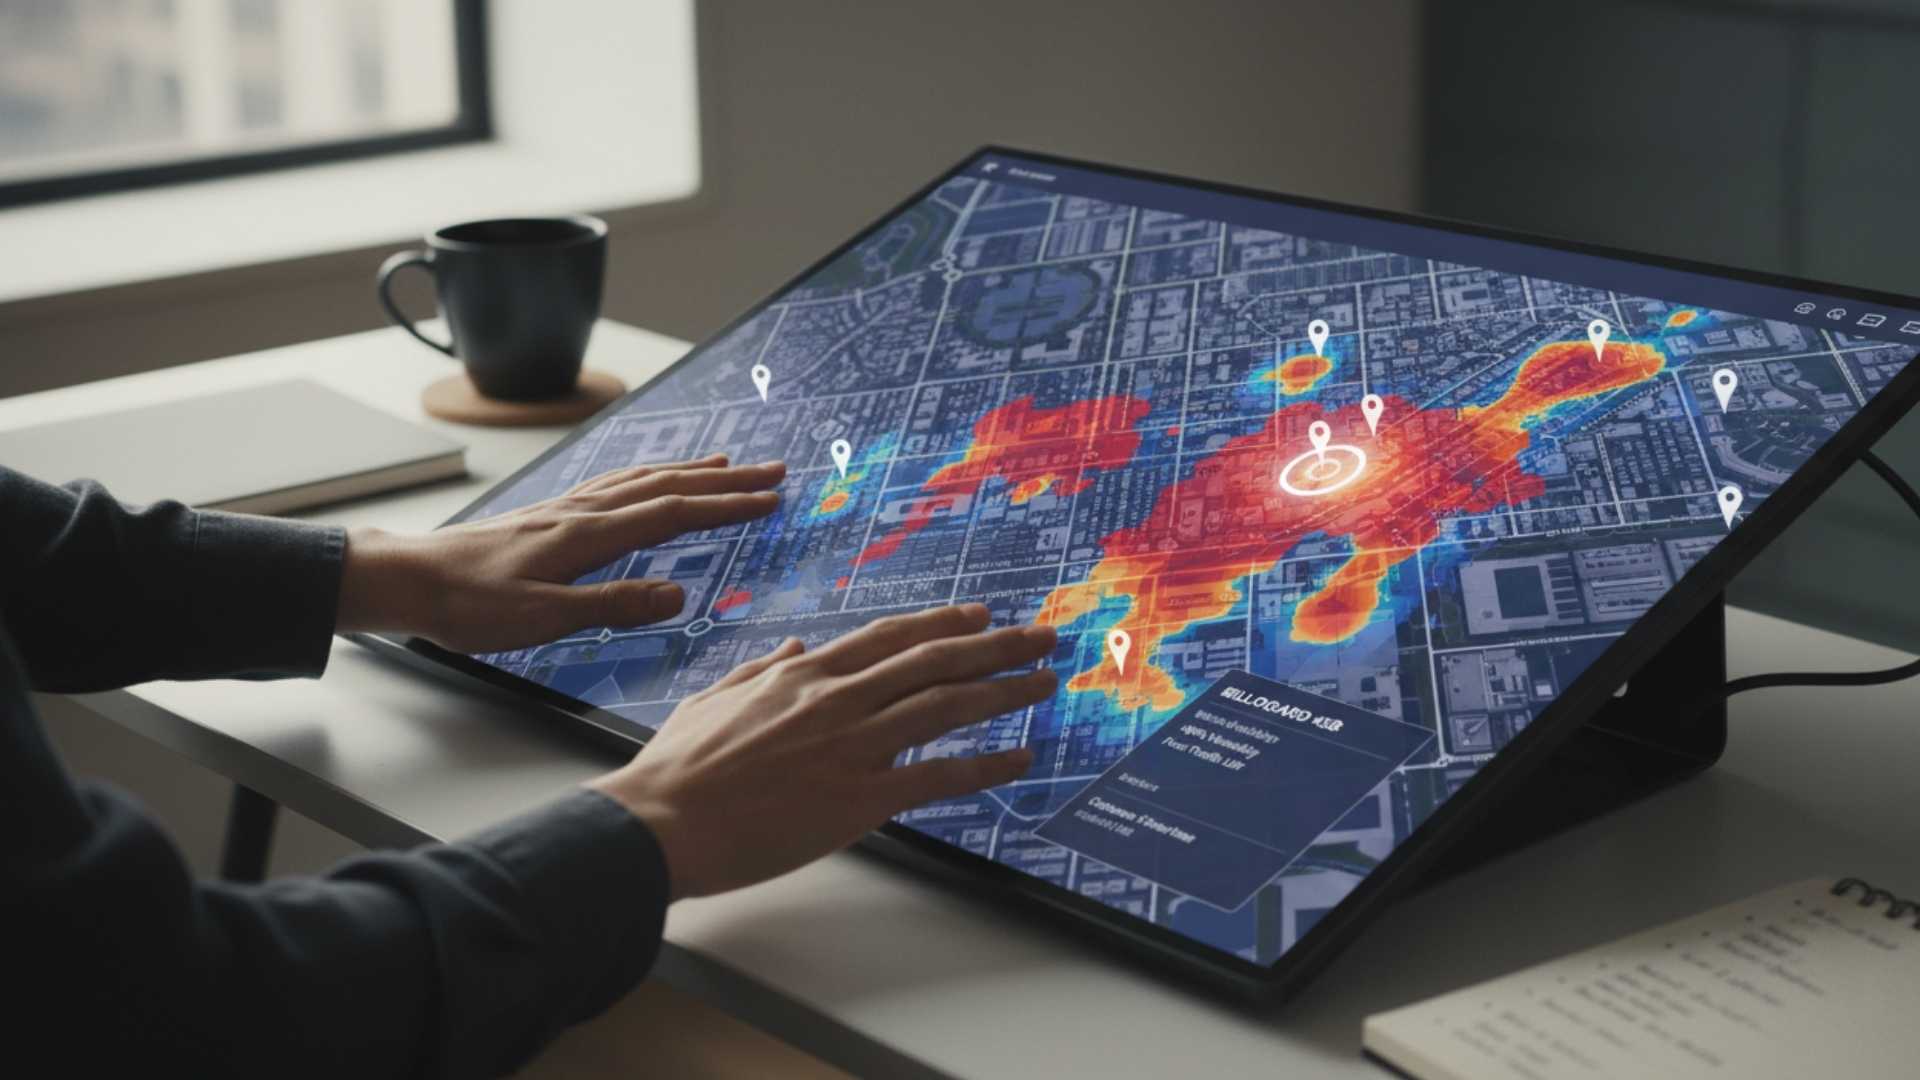
Step 2: Identify Hot Spots Where Your Audience Congregates
Once you know your audience’s demographic profile, you can map their behavioral patterns. Geospatial heat maps show where target customers shop, eat, commute, and spend leisure time. These reflect habitual movement. Pinpointing these high-density behavioral zones turns site selection from guesswork into a repeatable, evidence-based process.
Step 3: Apply Geospatial Targeting to Niche Segments
This is where the real competitive edge emerges. Granular audience segmentation: drilling down to profiles like “Weekend Fitness Enthusiasts” allows advertisers to match billboard placements to micro-audiences with surgical precision.
The underlying principle is simple: the best billboard location isn’t the most visible one, it’s the most relevant one.
Of course, selecting a great site is only half the battle. Even the most precisely placed billboard operates in a messy real world, one shaped by weather, competing marketing channels, and statistical noise. That’s exactly what the next section addresses.
Overcoming the Challenges of Foot Traffic Measurement in Billboard Advertising
Selecting the right billboard location and measurement method gets you most of the way there but accurate billboard foot traffic attribution still has a few stubborn obstacles to navigate. Acknowledging these limitations isn’t a weakness; it’s what separates reliable data from misleading dashboards.
Challenge 1: External Factors Like Weather and Local Events
Foot traffic doesn’t exist in a vacuum. A winter storm, a local festival, or a road closure can dramatically inflate or suppress visit counts — making your campaign look like a hero or a failure when neither is true. Seasonal and cyclical effects can skew foot traffic data by up to 30% if not normalized against historical baselines. The solution is always to benchmark against comparable periods — same day of week, same season — and flag anomalies in your reporting before drawing conclusions.
Challenge 2: Statistical Noise in Low-Density Areas
Rural and suburban billboard placements generate fewer raw visits, which means smaller sample sizes and wider confidence intervals. In practice, a 15% lift means something very different when it’s calculated from 50 visits versus 5,000. One practical approach is extending the measurement window for lower-traffic locations to accumulate enough data before declaring a result statistically significant.
Challenge 3: The Attribution Mix Problem
This is arguably the trickiest challenge. If you’re running social ads and billboard campaigns simultaneously, isolating which channel drove a store visit requires deliberate structure.
Pro Tip: Use geographic holdout groups — markets where you run the billboard but pause digital ads, and vice versa — to cleanly separate lift sources. Time-staggering campaign launches also helps untangle overlapping attribution.
Foot traffic lift data only becomes truly actionable once you trust what’s causing it. With cleaner attribution in hand, you’re ready for the most important calculation of all turning those visit numbers into actual revenue impact.
How to Calculate ROI from Billboard-Driven Foot Traffic
Once you’ve tackled attribution challenges, the real payoff is translating raw visit data into numbers that justify — or redirect — your spend. Solid OOH measurement doesn’t stop at counting visits; it connects those visits to actual revenue outcomes.
Step 1: Build Your Cost-Per-Visit Metric
Start simple. Divide your total billboard campaign cost by the incremental visits attributable to it. If a $15,000 campaign drives 3,000 net new store visits, your cost-per-visit is $5.00. Now benchmark that against your paid search or social campaigns. In practice, OOH frequently competes favorably, especially in high-traffic urban corridors where digital CPMs continue to climb.
Strong benchmarks make budget conversations much easier than gut feelings ever will.
Step 2: Layer In Conversion Rate and Transaction Value
Cost-per-visit alone doesn’t tell the full story. Multiply your incremental visits by your in-store conversion rate, then by average transaction value to estimate revenue-per-campaign. For example: 3,000 visits × estimated conversion × $42 average transaction = roughly $44,100 in attributable revenue. That’s a substantial return on a $15,000 investment — a number worth defending in any budget review.
Step 3: Use Proxy Metrics When Footfall Data Falls Short
Direct footfall data isn’t always available, especially for smaller campaigns. In those cases, monitor branded search volume spikes during your campaign window, track web traffic lift from billboard-adjacent zip codes, or analyze coupon redemption rates tied to billboard-specific offers. These proxies aren’t perfect, but they establish a directional baseline you can refine over time.
Building this ROI framework consistently across campaigns is exactly how you start developing the kind of proprietary performance database that separates strategic OOH buyers from everyone else.
Conclusion: Turning Foot Traffic Data into Competitive Advantage
Billboard advertising has always been a game of educated guesses but it doesn’t have to stay that way. As covered throughout this guide, the shift from impression counts to foot traffic measurement transforms outdoor advertising from a brand awareness cost into a quantifiable revenue driver.
Every campaign you run and measure builds something more valuable than a single ROI figure: a proprietary location intelligence database. Over time, patterns emerge which intersections convert, which dayparts drive visits, which creatives pull walk-ins. That compound knowledge becomes a genuine competitive edge.
Starting your first measured campaign:
- Pilot small – select one billboard location with a clean control period before launch
- Define your conversion event – store visit, coupon redemption, or landing page hit
- Benchmark and iterate – document baseline foot traffic, then compare post-launch lift consistently
The brands winning at outdoor advertising aren’t spending more — they’re measuring smarter. Start your pilot today.
Key Takeaways: Measuring Billboard ROI
- Shift to Performance: Billboards have evolved from awareness-only tools to performance marketing channels where billboard foot traffic attribution is now the standard.
- Data-Driven Methods: The most effective ways to track visits include mobile ID attribution, geofencing, QR codes, and hardware sensors (Wi-Fi/Bluetooth counters).
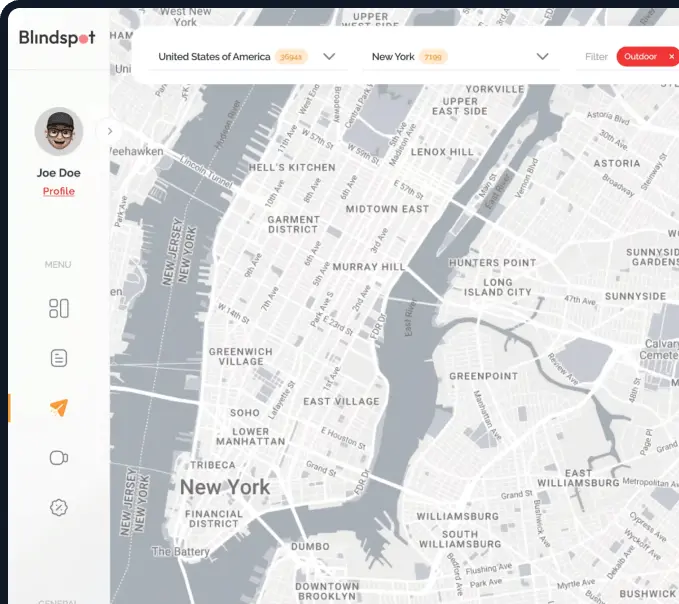
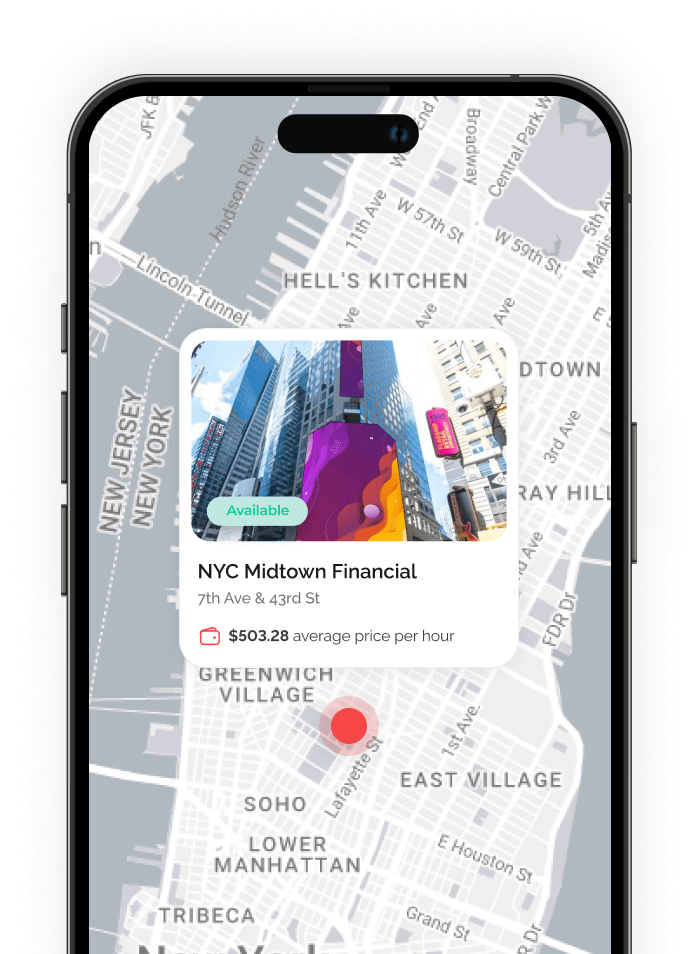
- Relevance Over Reach: Use Blindspot’s map to find locations where your specific demographic congregates, rather than just choosing high-volume intersections.
- Account for Noise: Accurate OOH campaign measurement requires normalizing data against weather, local events, and seasonal trends to isolate true lift.
- Calculate Real ROI: Move beyond cost-per-impression to cost-per-visit and revenue-per-campaign by integrating point-of-sale (POS) data.
Frequently Asked Questions (FAQ)
What is billboard foot traffic attribution?
Billboard foot traffic attribution is the process of linking a physical store visit to a specific out-of-home (OOH) advertisement. By using anonymized mobile location data, advertisers can determine if a consumer who was exposed to a billboard later visited a retail location, allowing for a direct calculation of campaign effectiveness.
How do you measure foot traffic from billboard advertising?
The most common method for foot traffic measurement in billboard advertising is mobile ID attribution. This involves tracking “pings” from mobile devices that pass through a billboard’s viewshed and later appear within a geofenced boundary around a place of business. Other methods include using unique QR codes, promo codes, or installing passive Wi-Fi sensors at the storefront.
What are the best foot traffic measurement billboard advertising softwares?
Many brands use custom dashboards that integrate Google Analytics (for web lift) with physical sensor data to get a 360-degree view of the customer journey.
Can I use software to automate OOH campaign measurement?
Yes, modern foot traffic measurement software automates the collection of geospatial data and provides real-time lift reports. These platforms allow marketers to compare “exposed” vs. “unexposed” groups automatically, removing the manual work of calculating incremental visits and ROI.
Is foot traffic measurement privacy-compliant?
Most reputable OOH campaign measurement methods rely on anonymized, aggregated data. Mobile ID attribution uses hashed IDs that do not contain personally identifiable information (PII), ensuring compliance with privacy regulations like CCPA and GDPR while still providing actionable insights for advertisers.